E-Submission
Indexed in: ESCI, Scopus, PubMed,
PubMed Central, CAS, DOAJ, KCI
PubMed Central, CAS, DOAJ, KCI
FREE article processing charge

Articles
- Page Path
- HOME > J Yeungnam Med Sci > Volume 37(2); 2020 > Article
-
Original article
Usefulness of subtraction pelvic magnetic resonance imaging for detection of ovarian endometriosis -
Hyun Jung Lee

-
Yeungnam University Journal of Medicine 2020;37(2):90-97.
DOI: https://doi.org/10.12701/yujm.2019.00353
Published online: October 10, 2019
Department of Obstetrics and Gynecology, School of Medicine, Kyungpook National University, Kyungpook National University Hospital, Daegu, Korea
- Corresponding author: Hyun Jung Lee, Department of Obstetrics and Gynecology, School of Medicine, Kyungpook National University, Kyungpook National University Hospital, 130 Dongdeok-ro, Jung-gu, Daegu 41944, Korea Tel: +82-53-420-5724, Fax: +82-53-423-7905, E-mail: obgy1019@hanmail.net
• Received: August 21, 2019 • Revised: September 18, 2019 • Accepted: September 26, 2019
Copyright © 2020 Yeungnam University College of Medicine
This is an Open Access article distributed under the terms of the Creative Commons Attribution Non-Commercial License (http://creativecommons.org/licenses/by-nc/4.0/) which permits unrestricted non-commercial use, distribution, and reproduction in any medium, provided the original work is properly cited.
- 5,721 Views
- 120 Download
- 3 Crossref
Abstract
-
Background
- To minimize damage to the ovarian reserve, it is necessary to evaluate the follicular density in the ovarian tissue surrounding endometriosis on preoperative imaging. The purpose of the present study was to evaluate the usefulness of subtraction pelvic magnetic resonance imaging (MRI) to detect ovarian reserve.
-
Methods
- A subtracted T1-weighted image (subT1WI) was obtained by subtracting unenhanced T1WI from contrast-enhanced T1WI (ceT1WI) with similar parameters in 22 patients with ovarian endometriosis. The signal-to-noise ratio (SNR) in ovarian endometriosis, which was classified into the high signal intensity and iso-to-low signal intensity groups on the T2-weighted image, was compared to that in normal ovarian tissue. To evaluate the effect of contrast enhancement, a standardization map was obtained by dividing subT1WI by ceT1WI.
-
Results
- On visual assessment of 22 patients with ovarian endometriosis, 16 patients showed a high signal intensity, and 6 patients showed an iso-to-low signal intensity on T1WI. Although SNR in endometriosis with a high signal intensity was higher than that with an iso-to-low signal intensity, there was no difference in SNR after the subtraction (13.72±77.55 vs. 63.03±43.90, p=0.126). The area of the affected ovary was smaller than that of the normal ovary (121.10±22.48 vs. 380.51±75.87 mm2, p=0.002), but the mean number of pixels in the viable remaining tissue of the affected ovary was similar to that of the normal ovary (0.53±0.09 vs. 0.47±0.09, p=0.682).
-
Conclusion
- The subtraction technique used with pelvic MRI could reveal the extent of endometrial invasion of the normal ovarian tissue and viable remnant ovarian tissue.
- Although pelvic ultrasonography (USG) is the initial method of choice for identifying and characterizing adnexal cystic structures, magnetic resonance imaging (MRI) is performed in patients selected based on the results of USG and severity of symptoms [1–3]. MRI is generally performed to exclude malignancies in cases of intermediate USG features of ovarian masses [4–6]. Recently, an increased number of nulliparous women with ovarian endometriosis and desire to preserve ovarian function have been the main cause of increased MRI examinations. In addition, it is necessary to evaluate the follicular density in the ovarian tissue surrounding the endometrial cyst on preoperative imaging, especially in younger patients scheduled for ovarian cystectomy, to minimize damage to the healthy ovarian tissue and to predict the remnant ovarian function.
- Typical MRI features of ovarian endometriosis include a high signal intensity on both T1-weighted images (T1WIs) and T2-weighted images (T2WIs), which persist on subsequent fat-suppressed T1WI [3,6]. However, chronic bleeding with accumulation of high concentrations of iron and protein in the endometriosis could cause gradual variations in the signal intensity [3,7,8]. As data are limited on gadolinium enhancement in the evaluation of endometriosis, the use of gadolinium is recommended as an “option” in the evaluation of indeterminate adnexal endometriosis, such as for distinction from other hemorrhagic adnexal lesions, luteal ovarian cysts, or tubo-ovarian abscesses. In addition, gadolinium enhancement is crucial for depicting strongly enhancing mural nodules if atypical features suggest potential malignancy on USG or T2WI [9,10]. However, the surgeon needs to consider the remnant ovarian tissue and endometriosis involving that area to avoid its destruction with blood coagulation or disruption of the ovarian blood supply while using the appropriate surgical approach [11]. However, it is difficult to determine the degree of invasion of endometriosis from stretching of the surrounding tissues because of the presence of cysts with inflammatory changes due to endometriosis [12]. In such cases, subtraction imaging of the ovary may be useful, in which the differential diagnosis includes displacement of the ovarian tissue and hemorrhagic endometriosis.
- After subtraction, native T1 signals disappear, and the remaining signals are due solely to the enhancement associated with shortening of the T1 relaxation time owing to the intravenous contrast administration or flow effect [13,14]. This technique is widely used, and determining the presence/absence of enhancement is critical [15]. Therefore, the purpose of the present study was to evaluate the usefulness of a standardization map of pelvic MRI for patients with ovarian endometriosis.
Introduction
- Retrospective data collection and analysis were approved by the institutional review board of Kyungpook National University Hospital (IRB No: KNUK 2017-06-012). The need for informed consent was waived due to the retrospective design of the study.
- Endometriosis was classified based on the Revised American Society for Reproductive Medicine classification [16]. Twelve patients had stage III endometriosis, and 10 patients had stage IV endometriosis. All patients underwent laparoscopic ovarian cystectomy. The final diagnosis was obtained based on the histopathological/cytological examination of the surgically excised specimen of the lesion. To avoid spontaneous T1 hyperintensity due to menstrual bleeding, MRI was scheduled to be performed after day 8 of the menstrual cycle. Before MRI examination, the patients underwent 6 hours of fasting, followed by an intramuscular administration of a peristaltic inhibitor. MRI examinations were performed on a 3.0T closed-magnet MRI machine (Skyra; Siemens Health Care, Erlangen, Germany). We used a set of 8-channel phased array coils dedicated to different body parts included in the study. Subtraction images were obtained after intravenous contrast injection to assess the presence of enhancement for adequate depiction of these lesions. Contrast-enhanced T1WI (ceT1WI) MRI including subtracted T1WI (subT1WI) sequences was performed with similar parameters, such as field of view, slice thickness, repetition time, echo time, and fat suppression, for both sequences.
- MRI scans were interpreted on a picture archiving and communications system workstation (PiViewStar; Infiniti, Seoul, Korea) to identify endometriosis. An objective visual assessment of MRI scans was used to assess the T1 signal intensity of ovarian cystic lesions. A single author (LHJ) qualitatively analyzed all MRI scans for ovarian endometriosis blinded to any information on clinical details. When the signal intensity of a cyst was higher than that of the adjacent myometrium, the cystic lesion was regarded to show a high signal intensity on T2WI. In contrast, when the signal intensity was similar to or lower than that of the myometrium, the cystic lesion was regarded to show an iso-to-low signal intensity on T2WI [3].
- Using the digital image analysis software ImageJ (1.47q, National Institutes of Health, Bethesda, MD, USA), axial pre- and post-contrast T1WIs, T2WIs, and subtraction images were evaluated. To evaluate comparability with the normal ovarian tissue, the signal-to-noise ratio (SNR) of the ovarian endometrial cyst and of the contralateral normal ovarian tissue were measured on all sequences.
- To evaluate the effect of contrast enhancement, a standardization map (standT1WI) was obtained by dividing subT1WI with ceT1WI and T1WI using ImageJ. Consequently, the number of pixels within standT1WI was scored from 0 (not perfused) to 1 (totally perfused) (Fig. 1). Each region of interest (ROI) was quantified by outlining it using the measurement tool on the software at the level of the maximal diameter of lesions. The pixel information, including area, mean signal intensity with standard deviation, kurtosis, and skewness, was compared with that of the normal ovary. In addition, we obtained the integrated density, which is the sum of the values of pixels in the image or selection.
- Statistical analyses were performed using SPSS version 13.0 for Windows (SPSS Inc., Chicago, IL, USA). The Student t-test. was employed to examine the difference in numerical variables. Statistical significance was set at a p-value <0.05.
Materials and methods
- This study included 22 patients with surgically confirmed ovarian endometriosis who underwent pelvic MRI. The mean age was 31.23±7.21 years. ceT1WI MRI including subT1WI was performed in all patients. On T2WI, the normal ovary showed cysts of varying sizes surrounded by the darker solid ovarian stromal tissue at the level of the maximum ovarian diameter and bright cysts surrounded by the darker solid ovarian stroma. ceT1WI showed well-enhanced tissue in an area of 380.51±75.87 mm2. The mean number of pixels in the included ROI in the normal ovary was 0.47±0.09 on standT1WI.
- The affected ovary showed an area of 56.15 mm2 at the level of the maximum ovarian diameter. In the visual assessment, 16 ovaries showed a high signal intensity, and 6 ovaries showed an iso-to-low signal intensity on T2WI. However, all cysts showed a low signal intensity on subT1WI (Fig. 2). Although SNR of the endometriosis with a high signal intensity was higher than that with an iso-to-low signal intensity, there was no difference in SNR after the subtraction (13.72±77.55 vs. 63.03±43.90, p=0.126) (Table 1).
- The area of the affected ovary was smaller than that of the normal ovary (121.10±22.48 vs. 380.51±75.87 mm2, p=0.002), but the mean number of pixels in the remaining viable tissue of the affected ovary was similar to that of the normal ovary (0.53±0.09 vs. 0.47±0.09, p=0.682) (Fig. 3). The integrated density was lower in the affected ovary than in the normal ovary (63.82±6.35 vs. 180.40±17.52, p<0.001) (Table 2).
Results
- Subtraction imaging is a readily available technique routinely used with MR angiography. It can adequately determine the degree of contrast enhancement in the background of tissues that showed a high signal intensity on unenhanced T1WI MRI, such as hemorrhage or cystic lesions with mucinous or high proteinaceous contents [14,17]. There are many potential applications for this technique, including detection of neoplasms in hemorrhagic masses and complicated cysts and determining the presence/absence of enhancement. Although a helpful tool, subtraction MRI is still underused for non-vascular cases. It can unambiguously evaluate contrast enhancement in lesions that showed initial T1 high signal intensity, thereby characterizing their nature. Complex ovarian cysts often show a high signal intensity on T1WI owing to the presence of intracystic hemorrhage.
- Qualitative detection of enhancement, such as visual assessment of such lesions, is often difficult because of hemorrhagic or proteinaceous contents producing a high signal intensity on T1WI. Subtraction imaging is highly sensitive for detection of enhancement within these lesions and for accurate classification of benign hemorrhagic cysts or cystic ovarian malignancies. Although subtraction MRI could help evaluate ovarian lesions, its use has not been widely discussed in the radiological literature [14,17-19]. In the present study, the possibility of endometriosis suggested with the subtraction technique was confirmed after the surgery in all 22 patients. Six patients in our study presented with an iso-to-low signal intensity on T2WI. In all of them, subtraction images showed the absence of enhancement within the lesions, regardless of the shading effect, confirming the diagnosis of endometriosis after the surgery. subT1WI can be useful in differentiating complex cystic lesions with T1 high signal intensity. In ectopic pregnancy, contrast enhancement may be mild, but on subtraction imaging, the differentiation is clearer [20]. The role of subT1WI is crucial in unusual subtypes of endometriosis, including scar endometriosis, infiltrating endometriosis, endometriosis with infection, or endometriosis in the adenomyotic uterus [3,21,22].
- Contrast enhancement depends on many variables. Therefore, standardization is required of the signal intensity scale for the effect of contrast enhancement [23].standT1WI was obtained by dividing subtraction images with non-enhanced images in the current study to analyze images performed in different environments. standT1WI showed no enhancement of the lesions in the six patients with a chocolate cyst. Subtraction of high-resolution images can aid in evaluation of the remnant ovarian tissue. Endometrial invasion of the ovarian tissue is associated with the ovarian function. Moreover, bilateral invasion of the ovarian tissue is associated with infertility. Therefore, preoperative evaluation of the viable ovarian tissue is important. standT1WI could be used to quantitatively analyze enhancement within this subset of cystic ovarian masses to prevent false-negative results. In addition, assessment of the extent of ovarian involvement is mandatory to determine the preoperative grade [24,25]. However, there are no definite MRI findings suggestive of deep invasion of the ovary. In this study, we regarded integrated density as the sum of pixel densities modified by area instead of the sum of the number of pixels. Although further clinical studies are required, the value could be a marker for remnant viable ovarian tissue. The presented technique could be useful in determination of the surgical approach for ovarian endometriosis.
- However, this technique has some disadvantages. Although subtraction MRI adds only a few extra minutes in the process after contrast-enhanced MRI (ceMRI), it requires strict adherence to a specific protocol [26,27]. The radiology staff should be trained to ensure that correct images are obtained, and the post-acquisition analysis is appropriate, including matching the exact pre- and post-contrast images to generate the subtracted image, which can be hampered by patient movement [28]. As a result, many images in our study were not suitable for analyses. These issues have not been highlighted by the previous studies on subtraction MRI. The utility of contrast MRI with the subtraction technique is rarely discussed.
- This study highlighted the role of subtraction imaging with MRI. Pelvic MRI with subtraction imaging revealed ovarian endometriosis invasion of the adjacent healthy ovarian tissue. Subtraction images showed the absence of enhancement within the lesions, confirming the diagnosis of hemorrhage due to endometriosis. The normalized perfusion index map could be helpful for evaluating the remnant ovarian tissue. The application of ceMRI with the subtraction technique has rarely been discussed; however, it could be promising for the preoperative evaluation in patients who desire ovarian preservation during the surgical treatment. In conclusion, the subtraction technique used with pelvic MRI could reveal the extent of the endometrial invasion and viable remnant ovarian tissue.
Discussion
-
Conflicts of interest
No potential conflict of interest relevant to this article was reported.
Notes
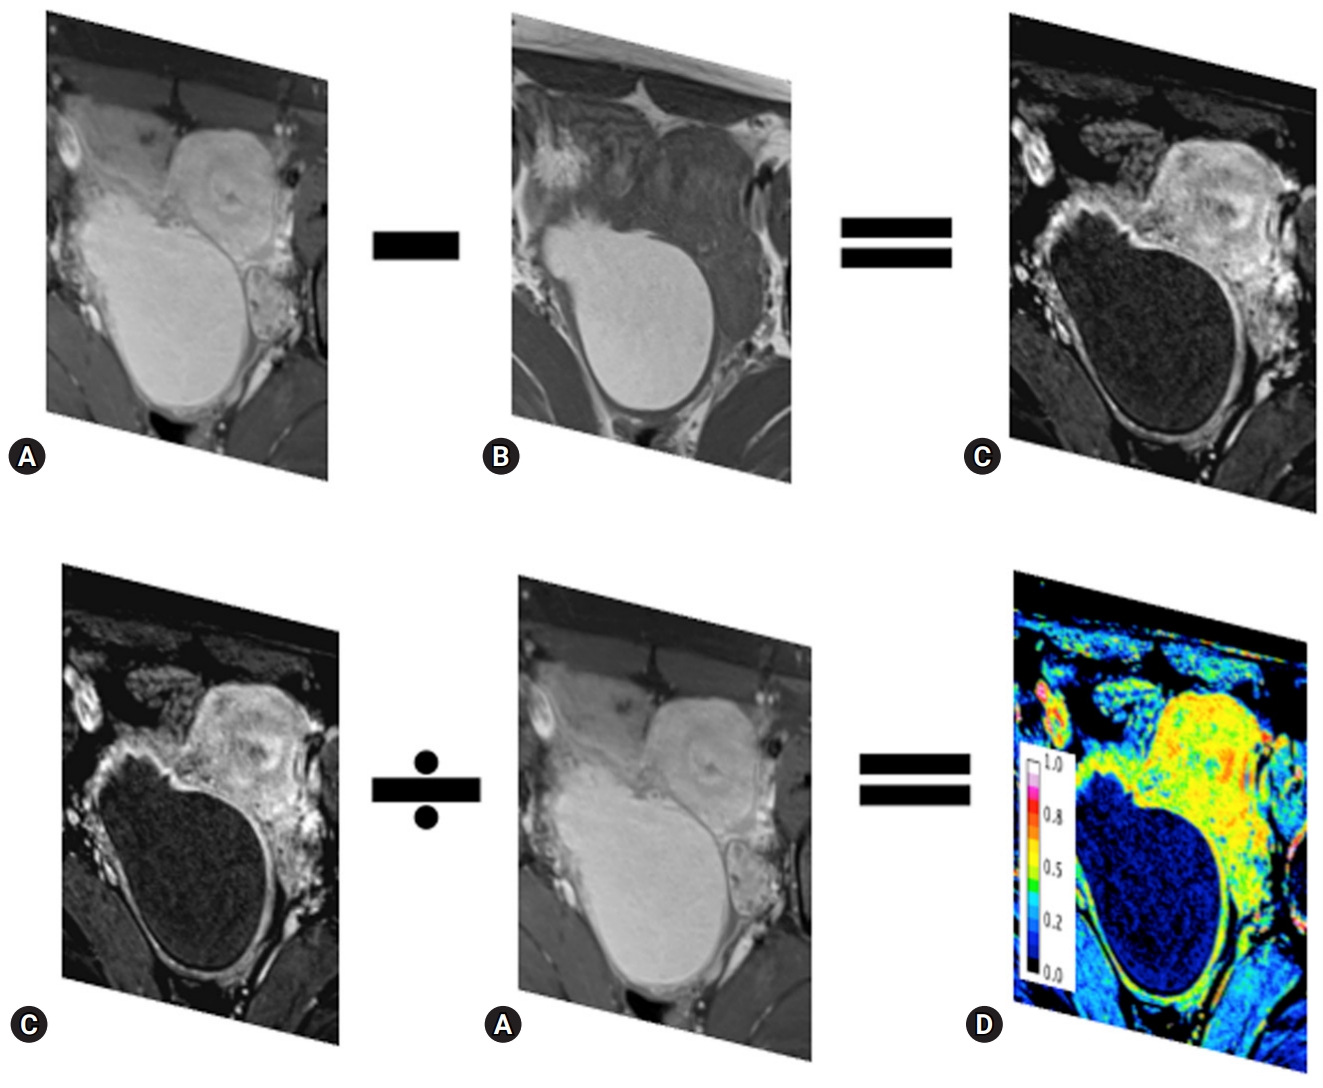
Fig. 1.Subtraction imaging and normalization of the contrast-enhanced effect. The ceTIWI (A) is subtracted by the unenhanced T1WI (B) to yield the subT1WI (C). To normalize the effect of contrast enhancement, the subT1WI (C) is divided by the ceT1WI (A) using ImageJ. The normalized perfusion map (D) is scored 0–1. ceT1WI, contrast-enhanced T1-weighted image; subT1WI, subtracted T1-weighted image.

Fig. 2.Multiple hemorrhagic cysts in a 36-year-old woman with endometriosis. The pre-contrast T1WI with fat suppression (A) and post-contrast T1WI in the arterial phase of enhancement with fat suppression (B) show multiple (arrows) high signal intensities. The subtraction image (C) shows low signal intensity, regardless of the pre-contrast imaging. The number of pixels ranges 0.01–0.12 (arrows) (D). T1WI, T1-weighted image.

Fig. 3.The T2-weighted image (A) and standardization map of the subtraction image (B) in a woman with endometriosis. The ovary with endometriosis (arrow) displaces the small ovarian follicles (white arrowheads). However, the mean number of pixels in the viable remaining tissue of the ovary with endometriosis is similar to that of the ovary without endometriosis (black arrowheads). Plotting (C) for the uterus, affected ovary, endometriosis, remnant ovary, and normal ovary show similar patterns between the remnant ovary and the normal ovary. The x-axis represents the mean number of pixels (dot) with standard deviation (bar), and the y-axis represents the area (dot) with integral density of the included structure (bar).

Table 1.Comparison of the signal-to-noise ratio between ovaries with and without endometriosis
| Ovarian endometriosis | Control | p-valuea) | |||
|---|---|---|---|---|---|
| T2 high SI (A) | T2 iso-to-low SI (B) | Normal ovary (C) | A&B | B&C | |
| T2WI | 945.31±116.53 | 557.86±72.18 | 574.61±155.06 | <0.001 | 0.824 |
| T1WI | 124.98±3.91 | 505.80±5.76 | 356.52±32.23 | <0.001 | 0.001 |
| ceT1WI | 329.40±17.56 | 572.25±76.21 | 697.48±88.97 | <0.001 | 0.002 |
| Subtraction | 13.72±77.55 | 63.03±43.90 | 340.97±91.98 | 0.126 | <0.001 |
Table 2.Comparison of the standardization map for the subtracted T1-weighted image between ovaries with and without endometriosis
| Affected ovary | Control | p-valuea) | |||
|---|---|---|---|---|---|
| Endometriosis (A) | Viable ovary (B) | Normal ovary (C) | A&B | B&C | |
| Area | 1,240.34±324.50 | 121.10±22.48 | 380.51±75.87 | <0.001 | 0.002 |
| Mean | 0.17±0.19 | 0.53±0.09 | 0.47±0.09 | <0.001 | 0.682 |
| Integrated density | 214.57±31.20 | 63.82±6.35 | 180.40±17.52 | <0.001 | <0.001 |
| Skewness | 1.03±20.79 | -2.30±0.32 | -1.13±0.30 | <0.001 | 0.453 |
| Kurtosis | -0.451±1.35 | 3.71±2.26 | 2.88±1.52 | <0.001 | 0.326 |
- 1. Hauth EA, Stattaus J, Kimmig R, Schmidt M, Forsting M. Magnetic resonance imaging (MRI) of the pelvis in diagnosing endometriosis. Zentralbl Gynakol 2005;127:76–82.ArticlePubMedPDF
- 2. Kinkel K, Frei KA, Balleyguier C, Chapron C. Diagnosis of endometriosis with imaging: a review. Eur Radiol 2006;16:285–98.ArticlePubMedPDF
- 3. Woodward PJ, Sohaey R, Mezzetti TP Jr. Endometriosis: radiologic-pathologic correlation. Radiographics 2001;21:193–216.ArticlePubMed
- 4. Nishio N, Kido A, Kataoka M, Kuwahara R, Nakao K, Kurata Y, et al. Longitudinal changes in magnetic resonance imaging of malignant and borderline tumors associated with ovarian endometriotic cyst comparing with endometriotic cysts without arising malignancy. Eur J Radiol 2018;105:175–81.ArticlePubMed
- 5. Tanaka YO, Okada S, Yagi T, Satoh T, Oki A, Tsunoda H, et al. MRI of endometriotic cysts in association with ovarian carcinoma. AJR Am J Roentgenol 2010;194:355–61.ArticlePubMed
- 6. Sugimura K, Okizuka H, Imaoka I, Kaji Y, Takahashi K, Kitao M, et al. Pelvic endometriosis: detection and diagnosis with chemical shift MR imaging. Radiology 1993;188:435–8.ArticlePubMed
- 7. Sanchez AM, Viganò P, Somigliana E, Panina-Bordignon P, Vercellini P, Candiani M. The distinguishing cellular and molecular features of the endometriotic ovarian cyst: from pathophysiology to the potential endometrioma-mediated damage to the ovary. Hum Reprod Update 2014;20:217–30.ArticlePubMedPDF
- 8. Togashi K, Nishimura K, Kimura I, Tsuda Y, Yamashita K, Shibata T, et al. Endometrial cysts: diagnosis with MR imaging. Radiology 1991;180:73–8.ArticlePubMed
- 9. Bazot M, Bharwani N, Huchon C, Kinkel K, Cunha TM, Guerra A, et al. European society of urogenital radiology (ESUR) guidelines: MR imaging of pelvic endometriosis. Eur Radiol 2017;27:2765–75.ArticlePubMedPDF
- 10. Forstner R, Meissnitzer M, Schlattau A, Spencer JA. MRI in ovarian cancer. Imaging Med 2012;4:59–75.Article
- 11. Working group of ESGE, ESHRE, and WES; Saridogan E, Becker CM, Feki A, Grimbizis GF, Hummelshoj L, et al. Recommendations for the surgical treatment of endometriosis-part 1: ovarian endometrioma. Gynecol Surg 2017;14:27.ArticlePubMedPMCPDF
- 12. Grammatikakis I, Evangelinakis N, Salamalekis G, Tziortzioti V, Samaras C, Chrelias C, et al. Prevalence of severe pelvic inflammatory disease and endometriotic ovarian cysts: a 7-year retrospective study. Clin Exp Obstet Gynecol 2009;36:235–6.PubMed
- 13. Guan X, Yu X, Liu X, Long J, Dai J. CT perfusion imaging and CT subtraction angiography in the diagnosis of ischemic cerebrovascular disease within 24 hours. Chin Med J (Engl) 2003;116:368–72.PubMed
- 14. Lee VS, Flyer MA, Weinreb JC, Krinsky GA, Rofsky NM. Image subtraction in gadolinium-enhanced MR imaging. AJR Am J Roentgenol 1996;167:1427–32.ArticlePubMed
- 15. Eid M, Abougabal A. Subtraction images: a really helpful tool in non-vascular MRI. Egypt J Radiol Nucl Med 2014;45:909–19.Article
- 16. American Society for Reproductive Medicine. Revised American Society for Reproductive Medicine classification of endometriosis: 1996. Fertil Steril 1997;67:817–21.ArticlePubMed
- 17. Newatia A, Khatri G, Friedman B, Hines J. Subtraction imaging: applications for nonvascular abdominal MRI. AJR Am J Roentgenol 2007;188:1018–25.ArticlePubMed
- 18. Hecht EM, Israel GM, Krinsky GA, Hahn WY, Kim DC, Belitskaya-Levy I, et al. Renal masses: quantitative analysis of enhancement with signal intensity measurements versus qualitative analysis of enhancement with image subtraction for diagnosing malignancy at MR imaging. Radiology 2004;232:373–8.ArticlePubMed
- 19. Yu JS, Rofsky NM. Dynamic subtraction MR imaging of the liver: advantages and pitfalls. AJR Am J Roentgenol 2003;180:1351–7.ArticlePubMed
- 20. Chanana C, Gupta N, Bansal I, Hooda K, Sharma P, Gupta M, et al. Different sonographic faces of ectopic pregnancy. J Clin Imaging Sci 2017;7:6.ArticlePubMedPMC
- 21. Bennett GL, Slywotzky CM, Cantera M, Hecht EM. Unusual manifestations and complications of endometriosis--spectrum of imaging findings: self-assessment module. AJR Am J Roentgenol 2010;194(6 Suppl):S84–8.ArticlePubMed
- 22. Gandhi D, Garg G, Solanki S, Nepal P. Deep infiltrating endometriosis: role of magnetic resonance subtraction imaging. Quant Imaging Med Surg 2018;8:722–3.ArticlePubMedPMC
- 23. Sun X, Shi L, Luo Y, Yang W, Li H, Liang P, et al. Histogram-based normalization technique on human brain magnetic resonance images from different acquisitions. Biomed Eng Online 2015;14:73.ArticlePubMedPMCPDF
- 24. Hornstein MD, Gleason RE, Orav J, Haas ST, Friedman AJ, Rein MS, et al. The reproducibility of the revised American Fertility Society classification of endometriosis. Fertil Steril 1993;59:1015–21.ArticlePubMed
- 25. Schultes G. Classification of endometriosis. Wien Med Wochenschr 1999;149:361–5.PubMed
- 26. Chan JH, Peh WC, Tsui EY, Wong KP, Yuen MK. Three-dimensional time-of-flight subtraction angiography of subacute cerebral hemorrhage. AJR Am J Roentgenol 2003;181:242–4.ArticlePubMed
- 27. Cheng B, Cai W, Sun C, Kang Y, Gong J. 3D bone subtraction CT angiography for the evaluation of intracranial aneurysms: a comparison study with 2D bone subtraction CT angiography and conventional non-subtracted CT angiography. Acta Radiol 2015;56:1127–34.ArticlePubMed
- 28. Jamil K, Walker T, Onikul E, Munns CF, Little DG. A comparison of subtraction MRI with the standard contrast-enhanced imaging in Perthes' disease. J Child Orthop 2019;13:82–8.ArticlePubMedPMC
References
Figure & Data
References
Citations
Citations to this article as recorded by 
- Biaxial ultrasound driving technique for small animal blood–brain barrier opening
Carly Pellow, Siyun Li, Sagid Delgado, G Bruce Pike, Laura Curiel, Samuel Pichardo
Physics in Medicine & Biology.2023; 68(19): 195006. CrossRef - Magnetic resonance imaging texture analysis for the evaluation of viable ovarian tissue in patients with ovarian endometriosis: a retrospective case-control study
Dayong Lee, Hyun Jung Lee
Journal of Yeungnam Medical Science.2022; 39(1): 24. CrossRef - Diagnosis and Nursing Intervention of Gynecological Ovarian Endometriosis with Magnetic Resonance Imaging under Artificial Intelligence Algorithm
Nijie Jiang, Hong Xie, Jiao Lin, Yun Wang, Yanan Yin, Arpit Bhardwaj
Computational Intelligence and Neuroscience.2022; 2022: 1. CrossRef
 PubReader
 ePub Link
 Cite
Cite